9 SEO Dashboards Every Agency Needs to Track Rankings, Traffic, Leads, and ROI
SEO agencies juggle multiple clients, campaigns, reporting deadlines, and performance metrics. Without a proper dashboard system, important insights get buried in spreadsheets, making it difficult to identify opportunities, communicate results, and prove ROI.
After managing SEO campaigns across local businesses, eCommerce brands, SaaS companies, and enterprise websites, one lesson becomes clear: successful agencies don’t track more metrics—they track the right metrics.
This guide covers the 9 essential SEO dashboards every agency should use, including the metrics to monitor, recommended tools, real-world use cases, and common reporting mistakes to avoid.
Quick Answer: What SEO Dashboards Should Every Agency Have?
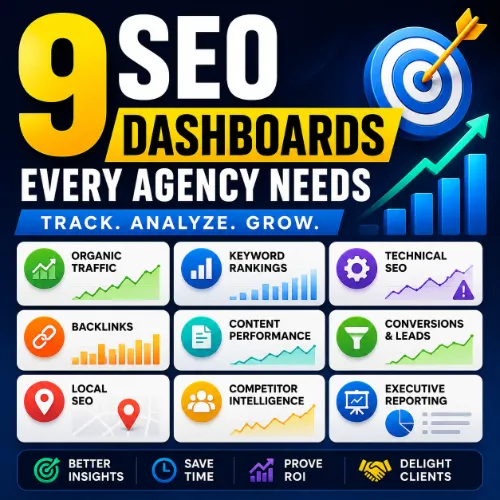
Every SEO agency should maintain these dashboards:
- Organic Traffic Dashboard
- Keyword Ranking Dashboard
- Technical SEO Dashboard
- Backlink Dashboard
- Content Performance Dashboard
- Conversion & Lead Generation Dashboard
- Local SEO Dashboard
- Competitor Intelligence Dashboard
- Executive Client Reporting Dashboard
Together, these dashboards provide a complete view of SEO performance—from visibility and rankings to leads, revenue, and ROI.
Why SEO Dashboards Matter for Agencies
SEO reporting isn’t simply about showing data. It’s about helping clients understand:
- What improved
- What declined
- Why changes happened
- What actions should come next
Many agencies lose clients because reports contain dozens of charts but fail to connect SEO activities to business outcomes.
Common Reporting Mistake
Many agencies spend hours reporting on:
- Impressions
- Average position
- Click-through rates
While clients actually care about:
- Leads
- Revenue
- Phone calls
- Sales
A properly structured dashboard bridges that gap.
1. Organic Traffic Performance Dashboard
Purpose
Track whether SEO efforts are increasing visibility and attracting qualified visitors.
Key Metrics
- Organic Sessions
- Organic Users
- New Users
- Landing Page Traffic
- Organic Conversion Rate
- Engagement Rate
- Average Engagement Time
- Year-over-Year Growth
Example Dashboard Layout
Traffic Overview Widget
- Organic sessions this month
- Month-over-month growth
- Year-over-year growth
Landing Page Widget
- Top traffic pages
- Fastest growing pages
- Traffic decline alerts
Conversion Widget
- Leads generated
- Revenue generated
- Conversion rate
Real Agency Insight
One of the most common mistakes agencies make is focusing only on traffic volume.
A page receiving 500 visits and generating 20 leads is often more valuable than a page receiving 5,000 visits with no conversions.
Recommended Tools
- Google Analytics 4 (GA4)
- Looker Studio
- Databox
2. Keyword Ranking Dashboard
Purpose
Monitor search visibility and ranking improvements.
Key Metrics
- Average Position
- Top 3 Keywords
- Top 10 Keywords
- Ranking Changes
- Visibility Score
- SERP Feature Ownership
Recommended Keyword Categories
Money Keywords
Keywords directly tied to revenue.
Example:
- SEO agency pricing
- Local SEO services
Informational Keywords
Top-of-funnel searches.
Example:
- What is local SEO
- SEO checklist
Brand Keywords
Searches related to your brand.
Example:
- Agency name
- Branded products
Real Agency Insight
Separating keywords into these three categories prevents clients from becoming obsessed with vanity rankings that generate little business impact.
Recommended Tools
- Ahrefs Rank Tracker
- Semrush Position Tracking
- AccuRanker
- SE Ranking
3. Technical SEO Dashboard
Purpose
Identify website issues that can limit rankings and crawling.
Key Metrics
- Crawl Errors
- Indexed Pages
- Non-Indexed Pages
- Core Web Vitals
- Broken Links
- Redirect Chains
- Duplicate Content
- XML Sitemap Health
Dashboard Example
Site Health Score
Overall technical health percentage.
Crawling Widget
- Pages crawled
- Crawl errors
- Blocked pages
Performance Widget
- Largest Contentful Paint (LCP)
- Interaction to Next Paint (INP)
- Cumulative Layout Shift (CLS)
Real Agency Insight
Technical SEO issues often account for some of the biggest ranking improvements because many websites unknowingly block search engines from accessing important content.
Recommended Tools
- Google Search Console
- Screaming Frog
- Sitebulb
- Ahrefs Site Audit
4. Backlink Monitoring Dashboard
Purpose
Measure authority growth and link-building success.
Key Metrics
- Referring Domains
- Total Backlinks
- Domain Rating (DR)
- Domain Authority (DA)
- Lost Links
- New Links
- Toxic Links
What Agencies Should Track Weekly
Link Acquisition
- New referring domains
- High-authority links
Link Loss
- Lost backlinks
- Lost referring domains
Link Quality
- Spam score
- Authority distribution
Common Reporting Mistake
Many reports focus on backlink quantity.
Search engines increasingly value:
- Relevance
- Authority
- Editorial placement
A single niche-relevant backlink may outperform dozens of low-quality links.
Recommended Tools
- Ahrefs
- Majestic
- Semrush
5. Content Performance Dashboard
Purpose
Evaluate how content contributes to rankings, traffic, and conversions.
Key Metrics
- Top Pages
- Organic Traffic by URL
- Conversion Rate by Page
- Engagement Metrics
- Content Decay Trends
- Internal Linking Opportunities
Dashboard Example
Winning Content
Pages growing traffic month-over-month.
Declining Content
Pages losing rankings or clicks.
Conversion Content
Pages generating leads or revenue.
Real Agency Insight
Content decay is one of the easiest SEO wins.
Many agencies recover lost traffic simply by updating:
- Statistics
- Internal links
- Outdated examples
- Search intent alignment
6. Conversion & Lead Generation Dashboard
Purpose
Connect SEO directly to business results.
Key Metrics
- Form Submissions
- Phone Calls
- Sales
- Revenue
- Cost Per Lead
- Conversion Rate
Why Clients Love This Dashboard
Most clients don’t care whether rankings increased from Position 7 to Position 4.
They care whether SEO generated:
- More leads
- More customers
- More revenue
Example Dashboard Widgets
Leads Generated
Monthly lead growth.
Revenue Attribution
Revenue from organic traffic.
Conversion Funnel
Visitors → Leads → Customers
Recommended Tools
- Google Analytics 4
- HubSpot
- Salesforce
- CallRail
7. Local SEO Dashboard
Purpose
Track visibility in local search results and Google Business Profile performance.
Key Metrics
- Local Pack Rankings
- Calls
- Website Clicks
- Direction Requests
- Reviews
- Average Rating
- Google Business Profile Views
Ideal Clients
- Dentists
- Restaurants
- Lawyers
- Contractors
- Medical Clinics
Real Agency Insight
For local businesses, Google Business Profile interactions often correlate more strongly with revenue than traditional organic traffic metrics.
Recommended Tools
- Google Business Profile
- BrightLocal
- Whitespark
- Semrush Local
8. Competitor Intelligence Dashboard
Purpose
Identify opportunities by monitoring competitors.
Key Metrics
- Competitor Rankings
- Share of Voice
- Keyword Gaps
- Content Gaps
- Backlink Gaps
- Estimated Traffic
Dashboard Example
Visibility Comparison
Agency Client vs Competitors.
Keyword Gap Analysis
Keywords competitors rank for but client doesn’t.
Link Gap Analysis
Authority-building opportunities.
Why It Matters
SEO is relative.
You don’t need to beat Google.
You need to outperform competitors.
9. Executive Client Reporting Dashboard
Purpose
Provide a simple overview of SEO performance for decision-makers.
Metrics to Include
- Traffic Growth
- Ranking Improvements
- Leads Generated
- Revenue Impact
- Backlink Growth
- Technical Health
- Next Month Priorities
Keep It Simple
The best executive dashboards answer:
What happened?
Traffic increased 32%.
Why did it happen?
New content and link acquisition improved rankings.
What’s next?
Expand topical authority and improve conversion rates.
Real Agency Insight
Executive dashboards often determine whether clients renew contracts because stakeholders rarely review detailed SEO reports.
Best SEO Dashboard Tools Compared
| Tool | Best For | Starting Price |
|---|---|---|
| Google Looker Studio | Custom dashboards | Free |
| AgencyAnalytics | SEO agencies | Paid |
| Databox | KPI reporting | Paid |
| Semrush | SEO reporting | Paid |
| Ahrefs | Rankings & backlinks | Paid |
| BrightLocal | Local SEO | Paid |
| Google Analytics 4 | Traffic & conversions | Free |
| Google Search Console | SEO performance | Free |
Common SEO Dashboard Mistakes Agencies Should Avoid
Tracking Too Many Metrics
More data doesn’t equal better insights.
Reporting Rankings Without Context
Rankings should connect to traffic and conversions.
Ignoring Revenue Attribution
SEO success should be tied to business outcomes.
Focusing on Vanity Metrics
High impressions don’t always mean high performance.
Creating One Dashboard for Every Client
Different businesses require different KPIs.
How Often Should Agencies Update SEO Dashboards?
| Dashboard | Recommended Frequency |
|---|---|
| Organic Traffic | Weekly |
| Rankings | Daily or Weekly |
| Technical SEO | Weekly |
| Backlinks | Weekly |
| Content Performance | Monthly |
| Conversions | Weekly |
| Local SEO | Weekly |
| Competitor Analysis | Monthly |
| Executive Reporting | Monthly |
Frequently Asked Questions
1. What is the difference between an SEO dashboard and an SEO report?
An SEO dashboard provides real-time access to performance data and key metrics, while an SEO report is typically a scheduled summary generated weekly or monthly. Dashboards are used for ongoing monitoring, whereas reports focus on communicating results and recommendations.
2. Can SEO dashboards automate client reporting?
Yes. Most modern SEO dashboard platforms allow agencies to automate reports and schedule email deliveries. This reduces manual work and ensures clients receive consistent updates without requiring analysts to create reports from scratch.
3. How many clients can an agency manage with dashboard automation?
The number varies depending on agency size and tools used. Agencies using automated dashboard systems often manage dozens or even hundreds of clients more efficiently than agencies relying on manual spreadsheets.
4. Should agencies create separate dashboards for different industries?
Yes. Different industries have unique KPIs. For example, a local dental practice may prioritize calls and appointment requests, while an eCommerce store focuses on transactions and revenue.
5. What is the ideal dashboard refresh frequency?
Most agencies refresh dashboards daily or in real time. However, strategic reviews are typically conducted weekly or monthly to identify trends and make optimization decisions.
6. Can SEO dashboards track AI search visibility?
Yes. Some advanced SEO platforms now monitor visibility across AI-driven search experiences, featured snippets, and emerging AI-generated search results. This helps agencies understand how content performs beyond traditional rankings.
7. What are vanity metrics in SEO dashboards?
Vanity metrics are statistics that appear impressive but provide little business value. Examples include raw impressions, total page views, or ranking improvements that do not lead to traffic, leads, or revenue growth.
8. Should agencies include social media metrics in SEO dashboards?
Only when social media contributes to content promotion, referral traffic, or brand visibility. Otherwise, social media metrics may be better tracked in a dedicated marketing dashboard.
9. How can agencies use dashboards to improve client retention?
Transparent reporting helps clients understand campaign progress and business impact. When clients can clearly see results and future opportunities, they are more likely to maintain long-term agency relationships.
10. Are spreadsheet-based SEO dashboards still effective?
Spreadsheets can work for small agencies or individual consultants. However, automated dashboard platforms are typically more efficient, scalable, and accurate for managing multiple clients.
11. What role do APIs play in SEO dashboards?
APIs allow dashboards to pull data automatically from platforms such as Google Analytics, Google Search Console, Ahrefs, Semrush, and CRM systems, reducing manual data entry and improving reporting accuracy.
12. How do agencies measure dashboard success?
A successful dashboard helps users quickly identify performance trends, make informed decisions, and understand business impact without spending excessive time analyzing data.
13. Can SEO dashboards help identify content gaps?
Yes. Content performance and competitor dashboards often reveal topics, keywords, and search intents that competitors rank for but the client has not yet addressed.
14. What dashboard metrics are most useful for eCommerce SEO?
eCommerce businesses typically focus on organic revenue, transactions, conversion rate, average order value, product page performance, and keyword visibility.
15. Should dashboards include predictive SEO forecasting?
Forecasting can be useful for larger campaigns. Predictive dashboards estimate future traffic, rankings, and revenue based on historical trends and planned SEO activities.
16. How can agencies prevent dashboard data overload?
Agencies should prioritize actionable KPIs, remove duplicate metrics, and focus on data that directly supports business objectives rather than displaying every available metric.
17. What are the benefits of white-label SEO dashboards?
White-label dashboards allow agencies to add their branding, logos, and custom designs, creating a more professional client experience and reinforcing brand identity.
18. Can SEO dashboards track multiple search engines?
Yes. Many platforms support ranking and visibility tracking across Google, Bing, Yahoo, and other search engines depending on the target market.
19. How do SEO dashboards support decision-making?
Dashboards centralize data from multiple sources, making it easier to identify opportunities, diagnose issues, prioritize tasks, and allocate resources effectively.
20. What future trends will impact SEO dashboards?
Future SEO dashboards are expected to include AI-driven insights, predictive analytics, automated anomaly detection, voice search monitoring, entity tracking, and expanded visibility reporting for AI-generated search experiences.
Final Thoughts
The most successful SEO agencies don’t win because they track more data. They win because they track the right data and present it in a way clients can understand.
A complete reporting system should include dashboards for traffic, rankings, technical SEO, backlinks, content performance, conversions, local SEO, competitor analysis, and executive reporting. Together, these dashboards provide a complete picture of SEO performance while helping agencies prove value, retain clients, and scale their operations.
If you’re building or refining your agency reporting process, start with these nine dashboards and focus on the metrics that directly impact business growth—not just search engine visibility.