
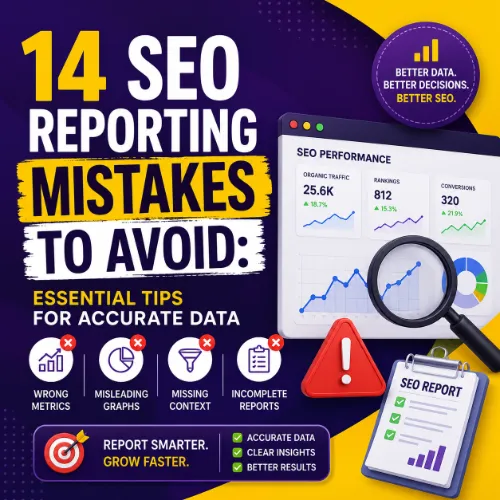
SEO reporting mistakes Key Takeaways
Accurate data drives better SEO decisions, but many reports are undermined by avoidable errors.
- The most frequent SEO reporting mistakes include cherry-picking metrics, ignoring context, and failing to align data with business goals.
- Fixing these errors involves using consistent date ranges, filtering out noise, and connecting performance changes to specific actions or algorithm updates.
- A well-structured report focuses on a few key performance indicators (KPIs) and tells a clear story about what happened and why.
Why Avoiding SEO Reporting Mistakes Matters for Your Strategy
Reporting isn’t just about collecting numbers. It’s about communicating progress, securing budget, and guiding future tactics. When you make SEO reporting mistakes, you risk misinforming decision-makers, wasting resources on the wrong optimizations, and losing credibility. Accurate reports turn data into a strategic asset. For a related guide, see 10 Product Page SEO Optimizations to Avoid Costly Mistakes.
The 14 Most Common SEO Reporting Mistakes and How to Fix Them
1. Reporting Vanity Metrics Instead of Actionable Ones
Many reports focus on total pageviews or domain authority, which sound impressive but don’t directly measure business impact. A high-traffic page that doesn’t convert is less valuable than a medium-traffic page with a strong conversion rate.
Fix: Prioritize metrics tied to revenue, leads, or user engagement. For ecommerce, track organic conversion rate and revenue per visitor. For lead generation, focus on form submissions from organic traffic.
2. Ignoring Context Behind Data Fluctuations
Presenting raw numbers without explaining why they changed is one of the most misleading common SEO reporting errors. A 20% traffic drop might look alarming until you mention a site migration, a Google core update, or a seasonal trend.
Fix: Always add a “Context” column or note next to major changes. Reference algorithm updates, technical changes, or competitive shifts.
3. Using Inconsistent Date Ranges
Comparing a 30-day period to a 28-day period or a holiday week to a normal week skews the story. This error creeps in when reports are generated on different days of the week.
Fix: Standardize on the same number of days per period and use a fixed day of the week for report generation. Always compare like-for-like: weekday vs. weekday, month vs. same month last year.
4. Failing to Segment Traffic by Channel
Blending organic, paid, social, and direct traffic into one “total traffic” number hides what’s really happening. If organic traffic is growing but paid traffic is declining, a combined view masks the organic win.
Fix: Build separate sections for organic search, paid search, social, email, and referral. Within organic, segment further by branded vs. non-branded keywords when possible.
5. Overlooking Goal Completions and Conversions
A report that shows only traffic and keyword rankings misses the ultimate question: “Did we generate value?” Without conversion data, you can’t prove ROI.
Fix: Set up goals in Google Analytics for key actions: purchases, sign-ups, downloads, or phone calls. Include conversion rate and goal completions in every report.
6. Not Aligning KPIs with Business Objectives
Reporting on impressions when the CEO cares about revenue creates a disconnect. This misalignment is one of the most costly SEO reporting mistakes because it erodes executive trust. For a related guide, see 15 eCommerce SEO Tips to Boost Sales and Avoid Costly Mistakes.
Fix: Before building any report, ask stakeholders: “What decision does this report need to support?” Then choose KPIs that answer that question directly.
7. Presenting Data Without Visual Hierarchy
Crowded tables with too many columns overwhelm readers. If every number is highlighted, nothing stands out.
Fix: Use a clean table for the top 5–10 KPIs, then drill down into details in supporting sections. Color-code performance: green for positive, red for negative, yellow for neutral.
8. Reporting on Keyword Rankings Without Share of Voice
A keyword ranking #5 for a high-volume term can be great, but if your competitor owns the top 3 positions and a featured snippet, your visibility is still low. Raw ranking positions don’t tell the full story.
Fix: Add estimated click-through rate (CTR) data or share of voice metrics. Tools like Ahrefs or Semrush can estimate traffic potential based on ranking position and SERP features.
9. Forgetting to Filter Internal Traffic
Visits from your own team or agency can inflate traffic numbers and distort bounce rate. This is a surprisingly common data contamination issue.
Fix: Exclude your office IP addresses and any VPN ranges your team uses. Set up a separate view in Google Analytics for unfiltered data if needed.
10. Ignoring Mobile vs. Desktop Performance
If mobile traffic accounts for 60% of your visitors, reporting only aggregate numbers hides mobile-specific issues like slow load times or poor navigation.
Fix: Segment performance by device. Report mobile traffic, mobile bounce rate, and mobile conversion rate as distinct metrics.
11. Providing Data Without Recommendations
A report that states “traffic dropped 15%” but doesn’t suggest what to do next invites confusion. Stakeholders need guidance, not just data.
Fix: End each section with a “Recommended Action” bullet. For example: “Traffic dropped due to thin content on category pages. Action: expand product descriptions by 200+ words.”
12. Relying on a Single Data Source
Google Analytics, Search Console, and your rank-tracking tool each have blind spots. Using only one source can produce inaccurate conclusions.
Fix: Cross-reference data from at least two sources. For example, compare organic traffic from Google Analytics with clicks reported in Search Console to spot discrepancies.
13. Not Tracking Backlink Changes
Backlinks are a major ranking factor, yet many reports ignore them. Losing a high-authority link can explain a traffic drop that otherwise seems mysterious.
Fix: Include a backlink health section showing new and lost referring domains. Flag any lost links from sites with DR 50+.
14. Sending the Same Report Format Every Period Without Evolution
Business goals shift, and your report should evolve. A static report format becomes a checklist item rather than a strategic tool.
Fix: Review your report template every quarter. Add new KPIs that reflect current priorities and retire metrics that no longer matter.
SEO Entities and Their Functions
Understanding the entities behind your data helps you build more precise reports. Here’s how key entities support analysis:
- Website / Domain entities: root domain, subdomain, and URL-level analysis help you identify whether performance gains come from the whole site, a section like blog.example.com, or a single page.
- Keyword entities: organic keywords, keyword difficulty (KD), search volume, and SERP features show demand, competition, and the type of result needed to rank.
- Backlink entities: referring domains, anchor text, and new/lost backlinks reveal authority flow, link quality, and risks.
- Page entities: top pages by traffic, top pages by links, and broken pages tell you which URLs earn visibility and which need repair.
- Technical SEO entities: crawl issues, redirect chains, canonicals, and Core Web Vitals expose obstacles that prevent ranking or good user experience.
- Competitor entities: competing domains, content gaps, and shared keywords show where rivals win traffic and where you can catch up.
Useful Resources
Deepen your reporting skills with these reliable guides:
- Ahrefs Blog: 20 SEO KPIs You Should Track — A detailed breakdown of key performance indicators for every reporting scenario.
- Google Search Central Blog — Official updates on algorithm changes and best practices that directly affect your report data.
Frequently Asked Questions About SEO reporting mistakes
What is the most common SEO reporting mistake ?
Reporting vanity metrics like total pageviews without connecting them to conversions or business goals is the most frequent error.
How often should I generate SEO reports?
Weekly for tactical teams tracking campaign changes, monthly for executive summaries, and quarterly for strategic reviews.
Should I include keyword rankings in every report?
Only if rankings tie directly to business goals. Otherwise, focus on organic traffic, conversions, and revenue.
What is a vanity metric in SEO reporting?
A vanity metric looks impressive but doesn’t guide decisions. Examples: total impressions, domain authority, or social media followers without engagement data.
How do I avoid cherry-picking data?
Set reporting KPIs before the reporting period begins. Stick to the same metrics and date ranges each time to ensure consistency.
What tools help reduce common SEO reporting errors ?
Google Search Console, Google Analytics, and a rank tracker like Ahrefs or Semrush. Cross-referencing two sources catches most discrepancies.
How do I explain a traffic drop in a report?
Check for algorithm updates, technical issues, competitor moves, and seasonal patterns. Always provide a likely cause before presenting the drop.
Should I report on backlinks?
Yes, if your campaign includes link building. Include new and lost referring domains and highlight any high-authority links gained or lost.
What is share of voice in SEO reporting?
It estimates your brand’s visibility relative to competitors for a set of keywords, often measured by estimated clicks or impression share.
How do I present SEO data to non-technical stakeholders?
Use simple language, visual charts for trends, and always tie changes to business outcomes like leads or sales.
What date comparison should I use?
Compare the same day of the week, same month last year, and use equal-length periods (30 vs. 30 days, never 28 vs. 31).
Can SEO reporting mistakes damage my client relationship?
Yes. Misleading data erodes trust. Transparent, contextual reports build stronger, longer-lasting partnerships.
How do I filter internal traffic from my reports?
Exclude office IP addresses and known VPN IPs in Google Analytics. Create a separate unfiltered view for raw data.
What is the difference between a KPI and a metric?
A KPI is a metric tied directly to a strategic goal. Not all metrics are KPIs. For example, page load time is a metric; Core Web Vitals pass rate for organic landing pages is a KPI.
Should I include mobile and desktop data separately?
Yes, if your audience is split. Segmenting reveals device-specific issues like poor mobile UX or slow desktop performance.
How do I handle seasonal data in reports?
Add seasonal benchmarks from previous years. Explain expected seasonal dips or spikes in a context note.
What should I do if my data sources disagree?
Investigate the discrepancy. Google Analytics may count users differently than a rank tracker. Document the methodology used for each source.
How many metrics should a weekly report have?
Focus on 5–10 KPIs. Too many metrics dilute the message and overwhelm readers.
Is it okay to report zero growth?
Yes. Honest reporting includes flat or negative periods. Explain what was tested, what didn’t work, and what you’ll try next.
How do I make SEO reports more actionable?
End each major section with a “Recommended Next Step.” Turn data into a to-do list for the team.